

Using a μ-Flowmeter in Dosing Applications

To ensure accuracy in dosing applications, dispensed volume is not typically obtained by direct volume measurement. It is usually derived from the amount of fluid flow over time. In general form this can be written as:

The nominal flow, that is flow rate set at the dosing pump, is used for this calculation. As long as the flow remains stable, the whole calculation should be valid. But how can we confirm if the fluid flow is stable?
In practice, the fluid flow does not remain constant over time. The relevant quantity is therefore not the nominal flow rate, but the actual flow in the system during dispensing. If the actual flow changes with time, even slightly, then the calculated volume changes as well. In this context, the accuracy of dosing is linked directly to the quality of the flow signal. Because of this a flowmeter can be used as a direct tool for accurate dosage control.
Why the actual flow can differ from the setpoint
A pump set to a constant value does not necessarily generate a perfectly constant flow. The mechanical principle of the dosing pump, pressure fluctuations in the fluid path, valve behaviour, and the physical properties of the liquid all contribute to deviations from the nominal value. These effects are often small but become increasingly significant in a micro dosing application.
This is already known from pump validation work in liquid chromatography [1], where the actual flow rate has to be measured in order to reveal deviations from the setpoint and to assess pump performance under realistic conditions. This exact same issue appears in micro dosing applications.
Observation from a micro dosing experiment
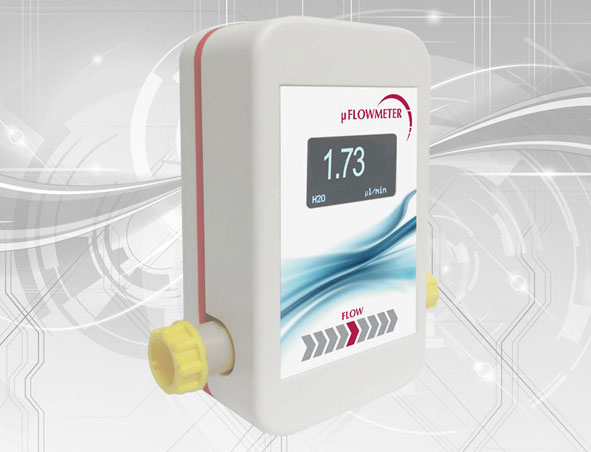
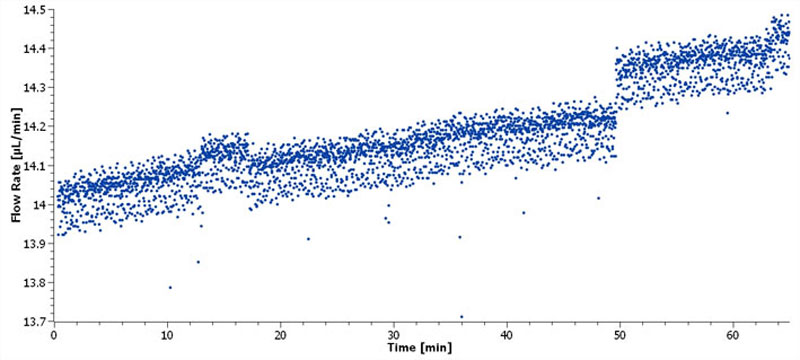
A micro dosing experiment with a sugar solution was monitored using an inline μ-flowmeter. The pump was set to deliver 14 μL/minute. If the process behaved ideally, the recorded signal would remain close to a horizontal line at this set value.
The measurement results shown in Figure 2 however shows a different picture. Over the course of roughly one hour, the flow signal drifts upward in a step-like manner from about 14.0 μL/min to around 14.45 μL/min. In between these plateaus, scatter is visible over the whole measurement window, and several pronounced downward spikes appear as well.
The signal therefore does not indicate a constant flow. The graph does not only show random noise, but rather drift, local dips, and scattering that may come from micro pulsation of the dosing pump.
How inline flow measurement helps
An inline μ-flowmeter gives users access to the actual flow profile during operation. This is of real benefit to the user because the signal is continuous. Short-term changes remain visible in the data, whereas a simple volume calculation only gives an average over the full dispensing period.
Thermal flowmeters are especially suitable for this task as the measurement is continuous and non-invasive. This is achieved through sensing elements located outside the flow channel, which then allows monitoring without disturbing the liquid path itself.
For larger dispense volumes, deviations observed in this trial may remain acceptable. But for microlitre volume dosing, the observed deviations become significant. Each dosing step corresponds to only a few microlitres, sometimes less, therefore the same variation in flow will result in a loss of accuracy in determining delivered volume.
If the liquid contains a dissolved active component, the deviation in volume directly translates into a deviation in delivered mass. This is particularly relevant in pharmaceutical micro dosing, where the absolute quantity per vial is small and the tolerance window are extremely narrow.
Using the real time flow data from the flowmeter, appropriate actions can be taken on batches that are subject to the out-of-specification fluctuations.
Conclusion
In the micro dosing experiment shown above, a nominally constant dosing delivery did not produce a constant measured flow. The signal drifted, showed local spikes, and changed in stages over time. For microlitre scale dosing, such behavior will significantly impact the accuracy of delivered volume and therefore for the delivered excipient mass as well. An inline μ-flowmeter enables users to access time and batch relevant information relating to the dosing process, which in turn allows you to take informed decisions about out of specification performance.
References
[1] A time-saving pump validation method for preparative chromatography – see https://www.testa-analytical.com/papers/paper54.html
Thank You!
Your message has been forwarded to our team and we will reply as soon as possible. Thank you for your patience.
© 2026 TESTA Analytical Solutions e.K. All rights reserved.